Online business
12 min read
Key customer satisfaction metrics you need to track in 2026
Not sure which customer satisfaction metric suits your needs? Explore key metrics like NPS, CSAT, and CES to enhance your customer experience and retention.

Written by
John AdkinsReviewed by
Marta Jagosz
Updated on
January 2, 2026
Published on
March 27, 2025

Monitoring changes in your customer satisfaction levels is a job that never ends. You can use several metrics to measure customer satisfaction, each with its own focus and value when trying to monitor this key performance indicator. Join us for a look at some common methods used to determine whether or not you're delivering the great customer experience that your clients expect.
Ready to start tracking customer satisfaction in ways that will help you keep them coming back for more instead of looking for other options? Read on!
Measure customer satisfaction with these key metrics
Business success is never based on just one factor but it’s hard to achieve without a high customer satisfaction levels. Happy customers are more likely to stay loyal, recommend your brand, and contribute to long-term revenue growth. But how do you know if your customers are truly satisfied? How do you gauge customer satisfaction? That’s where customer satisfaction metrics come in.
These metrics provide valuable insights into how customers perceive your products, services and overall brand experience. They help businesses identify strengths, pinpoint areas for improvement, and make data-driven decisions that enhance customer loyalty.
We’re going to take a look at the most essential customer satisfaction metrics, why they matter and how to measure them effectively to drive business growth. Whether you’re looking to boost retention, improve customer experience or gain a competitive edge, understanding these metrics is a crucial first step toward unlocking the true potential of any business.
The importance of measuring customer satisfaction
Sure, we all intuitively know what it means for customers to be satisfied, but before you can measure something, you have to know exactly what you’re measuring. Let’s break down “Customer Satisfaction” into its parts:
The core idea
- Customer satisfaction is the degree to which customers are happy, not just with the product or service they buy, but with the overall transaction they conduct with a business. It’s about the customer’s perception of whether their needs and desires were satisfied and if they feel they chose the right seller or vendor to do so.
Determining factors
- Products and services: This includes the quality, functionality and value of a purchase.
- Customer Experience (CX): All interactions a customer has with the company, from initial contact to post-purchase support.
- Expectations: Customer satisfaction is heavily influenced by whether a company meets or surpasses what customers expect.
Significance
- High customer satisfaction is crucial for building customer loyalty, generating repeat business, and fostering positive word-of-mouth.
- Conversely, low satisfaction can lead to customer churn, negative reviews, damage to a company's reputation and a fall in sales, which can in turn result the end of the business.
How is customer satisfaction measured?
Any useful metric in business has to be based on actual numbers, but how can you rate their satisfaction level in a useful way? How do you put a value on something based on individual personal impressions? Is that even possible?
It is, by getting customer feedback and organizing it in a way that provides insights into a brand’s performance. This information is so valuable to those brands that much research has gone into crafting the most accurate, reliable ways to measure customer satisfaction and three methods in particular have emerged has industry standards for establishing the best possible metrics:
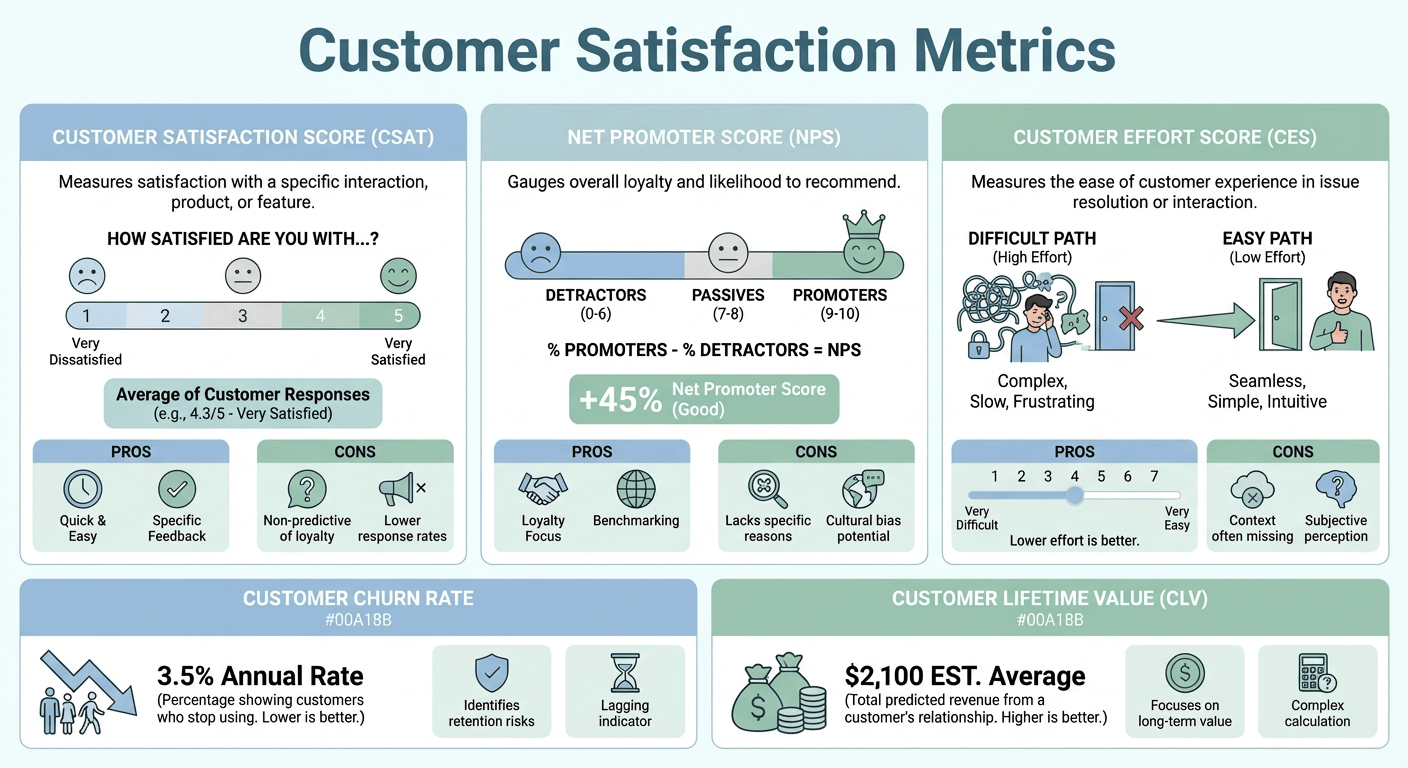
- Customer Satisfaction Score (CSAT)
- Net Promoter Score (NPS)
- Customer Effort Score (CES)
These metrics measure customer satisfaction and provide insights into customer behavior that Let’s take a look at each one in turn and learn how they’re calculated, what their strengths are and how they are different from each other.
Customer Satisfaction Score (CSAT)
The Customer Satisfaction Score (CSAT) is a common metric for measuring how satisfied customers are with a company's products or services. The CSAT measures how happy customers are with a specific part of your business, like a recent support call or a product they just bought. You find this out by asking them to rate their experience on a simple scale, like from 1 to 5, where 1 is "very unhappy" and 5 is "very happy." It's a quick way to see how well you're doing at individual customer interactions.
The CSAT score is calculated as a percentage:
(Number of satisfied responses / Total number of responses) x 100 = CSAT percentage
For example, suppose a company receives 100 survey responses on a 1-5 scale and 60 of those responses are either a 4 or a 5. The CSAT score would be: (60 / 100) x 100 = 60%.
Key points:
- CSAT measures short-term satisfaction with specific interactions and customer touchpoints.
- The interpretation of a "good" CSAT score can vary by industry.
- CSAT is one of many metrics that companies use to assess customer sentiment.
Advantages of the CSAT as an indicator of customer satisfaction:
- Simplicity and ease of use: CSAT surveys are typically short and straightforward, often involving a single question with a simple rating scale. This makes them easy for customers to complete, leading to higher response rates. Also, the data generated is also easy to analyze and understand.
- Real-time feedback: The CSAT can be used to capture immediate feedback after a specific interaction, such as a customer service call or a purchase. This provides valuable insights into the customer's "right here, right now" experience.
- Flexibility: CSAT surveys can be deployed across various touchpoints in the customer journey, allowing businesses to track satisfaction at different stages.
- Benchmarking: Because the CSAT is widely used, businesses can often benchmark their scores against industry standards.
- Actionable data: The CSAT can help quickly identify areas where customer service or product performance needs improvement.
Disadvantages of the CSAT as an indicator of important customer satisfaction metrics:
- Limited depth: The CSAT provides a snapshot of customer satisfaction but doesn't necessarily reveal the underlying reasons for that satisfaction or dissatisfaction.
- Subjectivity and bias: CSAT scores are based on self-reported data, which can be influenced by factors such as the customer's mood, personal biases, and cultural differences. Responses can be skewed towards extreme positive or negative experiences.
- Short-term focus: The CSAT primarily measures satisfaction with specific interactions, not overall customer loyalty or long-term relationships.
- Lack of context: A CSAT score alone might not provide enough context. For example, a "satisfied" rating could mean different things to different customers.
Net Promoter Score (NPS)
The Net Promoter Score (NPS) is another common customer loyalty metric that measures how likely customers are to recommend your company, product, or service to others. It's very focused as to simplify the whole concept of customer satisfaction. In fact, it's so focused that it reflects customer responses to a single question. Here's a breakdown of how it's calculated:
The core of NPS is a single question: "How likely are you to recommend [company/product/service] to a friend or colleague?" Respondents answer on a scale of 0 to 10, where 0 'Not at all likely' and 10 is 'Extremely likely.' Respondents are categorized this like this:
- Promoters (9-10): The most loyal and enthusiastic customers. They are very likely to recommend a business to others.
- Passives (7-8): These customers are satisfied but not enthusiastic. They are vulnerable to competitors.
- Detractors (0-6): These are dissatisfied customers who are likely to damage a brand through negative word-of-mouth.
The NPS is calculated by subtracting the percentage of Detractors from the percentage of Promoters. The formula is: NPS = % of Promoters - % of Detractors.
Passives are not included in the calculation of the NPS itself, but they are still valuable for understanding overall customer sentiment. Here's an example of how an NPS is calculated:
- Let's say you receive 100 survey responses:
- 60 are Promoters (9-10)
- 20 are Passives (7-8)
- 20 are Detractors (0-6)
- Calculations:
- % of Promoters = (60/100) * 100 = 60%
- % of Detractors = (20/100) * 100 = 20%
- NPS = 60% - 20% = 40
Key points:
- The NPS can range from -100 to +100.
- A positive NPS indicates that you have more Promoters than Detractors.
- It's important to track NPS over time to identify trends and measure the impact of customer experience improvements.
- While the score is a number, the most valuable part of NPS programs, is the "why" behind the score. Therefore, many companies follow the initial NPS question with open-ended questions, to gain more insight and better understand customer perspectives.
The Net Promoter Score (NPS) is a popular metric used to measure customer loyalty and satisfaction. It's based on a single question: "On a scale of 0 to 10, how likely are you to recommend our company/product/service to a friend or colleague?"
Here's a breakdown of its pros and cons:
Advantages of using NPS to track customer satisfaction:
- Simplicity: The single-question format makes it easy for customers to respond and for businesses to collect data. The scoring system (Promoters, Passives, Detractors) is straightforward and easy to understand.
- Customer loyalty indicator: NPS is designed to gauge customer loyalty, which is a strong predictor of future business growth. It helps identify customers who are enthusiastic advocates (Promoters) and those who are at risk of leaving (Detractors).
- Benchmarking: NPS is widely used across industries, allowing businesses to benchmark their performance against competitors. This provides valuable insights into how a company's customer loyalty compares to industry standards.
- Actionable insights: While the core NPS question provides a score, follow-up questions can be used to gather qualitative feedback, revealing the reasons behind customer ratings, which helps businesses identify areas for improvement and take targeted action.
- Company-wide metric: NPS can be used across entire organizations, creating a single metric that many departments can use to focus on improvement.
Disadvantages of using NPS to measure your customer satisfaction:
- Lack of granularity: The 0-10 scale can be subjective, and it may not capture the nuances of customer sentiment. NPS provides a broad overview of loyalty but may not reveal specific areas of satisfaction or dissatisfaction.
- Cultural variations: Response patterns can vary across cultures, making it challenging to compare NPS scores across different regions. A "good" score can also differ based on cultural norms.
- Limited context: NPS alone doesn't provide a complete picture of the customer experience. It's usually necessary to combine NPS with other metrics and qualitative feedback to gain a comprehensive understanding of customer satisfaction.
- Potential for manipulation: If employees are incentivized solely on NPS scores, they may engage in tactics to inflate ratings, which can distort the data.
- Doesn't explain why: While NPS can show that there is a problem, or that things are going well, it doesn't give a clear indication of the root cause of the score. Therefore, follow-up questions are very important.
Customer Effort Score (CES)
The Customer Effort Score (CES) is another method used to measure and improve customer satisfaction. customer experience metric that measures how easy it is for customers to interact with a company. Essentially, it gauges the amount of effort a customer has to exert to get something done. This could involve resolving an issue, making a purchase, or finding information.
Here's a breakdown:
What CES measures:
- Ease of interaction: CES focuses on reducing friction in the customer journey. It assesses how "effortless" a customer's experience is.
- Customer loyalty: Research indicates that reducing customer effort is a strong predictor of customer loyalty.
How CES is measured:
- Surveys:
- CES is typically collected through surveys, often immediately after a customer interaction.
- A common survey statement is: "[Company] made it easy for me to handle my issue."
- Customers respond on a scale, usually a 5-point or 7-point Likert scale (e.g., "strongly disagree" to "strongly agree").
- Scales:
- While scales can vary, a 7-point scale is common.
How CES is calculated:
- There are a couple of ways this is calculated, depending on the scale used.
- Average score:
- One method is to calculate the average score of all responses. This provides a general indication of the overall effort level.
- Percentage of positive responses:
- Another method, similar to CSAT, involves calculating the percentage of customers who gave positive responses (e.g., ratings of 5, 6, or 7 on a 7-point scale).
- To calculate this you would use this formula: (Number of positive responses / Total number of responses) x 100 = CES percentage.
- If using an emoticon scale, you would subtract the percentage of negative responses from the percentage of positive responses.
- Average score:
Key points:
- CES focuses on minimizing customer effort.
- It's often used to evaluate specific interactions, such as customer support experiences.
- By tracking CES, companies can identify areas where they can simplify processes and improve the customer experience.
The Customer Effort Score (CES) focuses on how easy it is for customers to interact with a company, aiming to minimize the effort required to resolve issues.
Here's a breakdown of its pros and cons:
Advantages of using CES to collect customer satisfaction data:
- Predicts customer loyalty: Research suggests that reducing customer effort can be a strong predictor of customer loyalty. Customers who find it easy to do business with a company are more likely to remain loyal.
- Actionable insights: CES surveys pinpoint specific areas where customers encounter friction. This allows businesses to make targeted improvements to streamline processes and enhance the customer experience.
- Focus on ease: CES directly addresses a key driver of customer satisfaction: ease of use. By focusing on minimizing effort, businesses can create a more positive and efficient customer journey.
- Useful for transactional interactions: CES is very useful for getting feedback on specific customer interactions, such as after a customer service call.
Disadvantages of using CES as a customer satisfaction survey:
- Limited scope: CES primarily focuses on transactional interactions and may not capture the overall customer relationship or brand perception. It measures effort related to a specific interaction, not necessarily overall satisfaction.
- Subjectivity: Perceptions of effort can vary significantly among customers, depending on individual expectations and experiences.
- Lack of context: A high or low CES score alone may not provide sufficient context. Businesses need to gather additional qualitative feedback to understand the underlying reasons for customer effort.
- Benchmarking challenges: While CES is growing in popularity, benchmarking can still be challenging compared to more established metrics like NPS.
- Does not capture the emotional connection: CES is very good at capturing how easy or hard it was to do something, but it does not capture if the customer was happy, or felt valued.
More customer satisfaction KPIs
In addition to the three specially constructed tests described above, your churn rates and customer lifetime value (CLV) levels can also be used to measure customer satisfaction. These metrics help gauge changes in how you are meeting customer expectations and can serve as an early warning of problems to be solved. Combined with CSAT, NPS or CES scores, they can further clarify any issues you might be facing with customer retention.
[fs-toc-omit]Customer churn rate as a customer satisfaction metric
- High churn = Low satisfaction
- A high churn rate signifies that a significant portion of your customers are leaving. This is a strong signal that they are dissatisfied with your product, service, or overall customer experience. Customers don't typically leave if they are highly satisfied, so a rising churn rate should trigger an investigation into potential problem areas.
- Analyzing churn patterns
- By analyzing churn patterns, you can identify specific points in the customer journey where dissatisfaction is highest. For example, are customers churning after a particular interaction with customer support, or after a specific period of product usage? Try to pinpoint where you are losing customers and search for the triggering event or stage.
[fs-toc-omit]Customer lifetime value (CLV) as an important customer satisfaction indicator.
- High CLV = High satisfaction
- Customers with a high CLV are those who remain loyal to your brand for an extended period and generate significant revenue, indicating that they are satisfied with their experience.
- Satisfied customers are more likely to make repeat purchases, upgrade their subscriptions, and recommend your brand to others, all of which contribute to a higher CLV.
- CLV and retention
- CLV is directly linked to customer retention. The longer you retain a customer, the higher their potential CLV.
- Therefore, efforts to improve customer satisfaction and reduce churn will directly impact CLV.
[fs-toc-omit]Track Customer Satisfaction by Combining Churn Rate and CLV
- Identifying valuable but dissatisfied customers
- By combining churn rate and CLV data, you can identify high-value customers at risk of churning. This allows you to prioritize efforts to address their concerns and improve their satisfaction.
- Measuring the impact of customer satisfaction initiatives
- You can track changes in churn rate and CLV over time to measure the effectiveness of customer satisfaction initiatives. For example, if you implement a new customer support system, you can monitor whether it leads to a decrease in churn and an increase in CLV.
- Understanding customer segments
- Analyzing churn and CLV across different customer segments can reveal variations in satisfaction levels. This can help you tailor your strategies to meet the specific needs of each segment.
Churn Rate and Customer Lifetime Value can both serve as useful customer satisfaction KPIs and provide a more holistic "customer health score." Use them in combination with the other methods listed above to identify the source of low customer satisfaction and keep your customer retention rate where it should be.
Automated way to provide excellent customer service
Creating a high-quality product is essential to delight your customers, but it’s equally important to manage their entire experience. From the moment they discover your product to purchasing, accessing it, and receiving support—everything should work smoothly and efficiently. How can you achieve this without expanding your customer service team? The answer is automation!
With Easytools, you not only ensure a flawless checkout experience and automatic delivery of purchases, but you can also set up automated workflows to nurture your customers and provide exceptional support. Plus, our integration with Stripe allows you to easily track churn rates and customer lifetime value (CLV).
Ready to increase customer satisfaction with zero effort? Test Easytools for free for 14 days.
No fees, no legal hassle – start selling anywhere instantly.
Sign up FREECancel anytime · No merchant lock-in

More
Related articles
Ready for more? Check out these related articles that will keep your momentum going. They’re packed with easy-to-follow tips and tricks to help you supercharge your digital goods business.


Start now
Take it easy with Easytools
Focus on creating, and let Easytools handle the behind the scenes work.
No coding · No credit card required · Built on Stripe
© 2024 Easytools. All rights reserved.